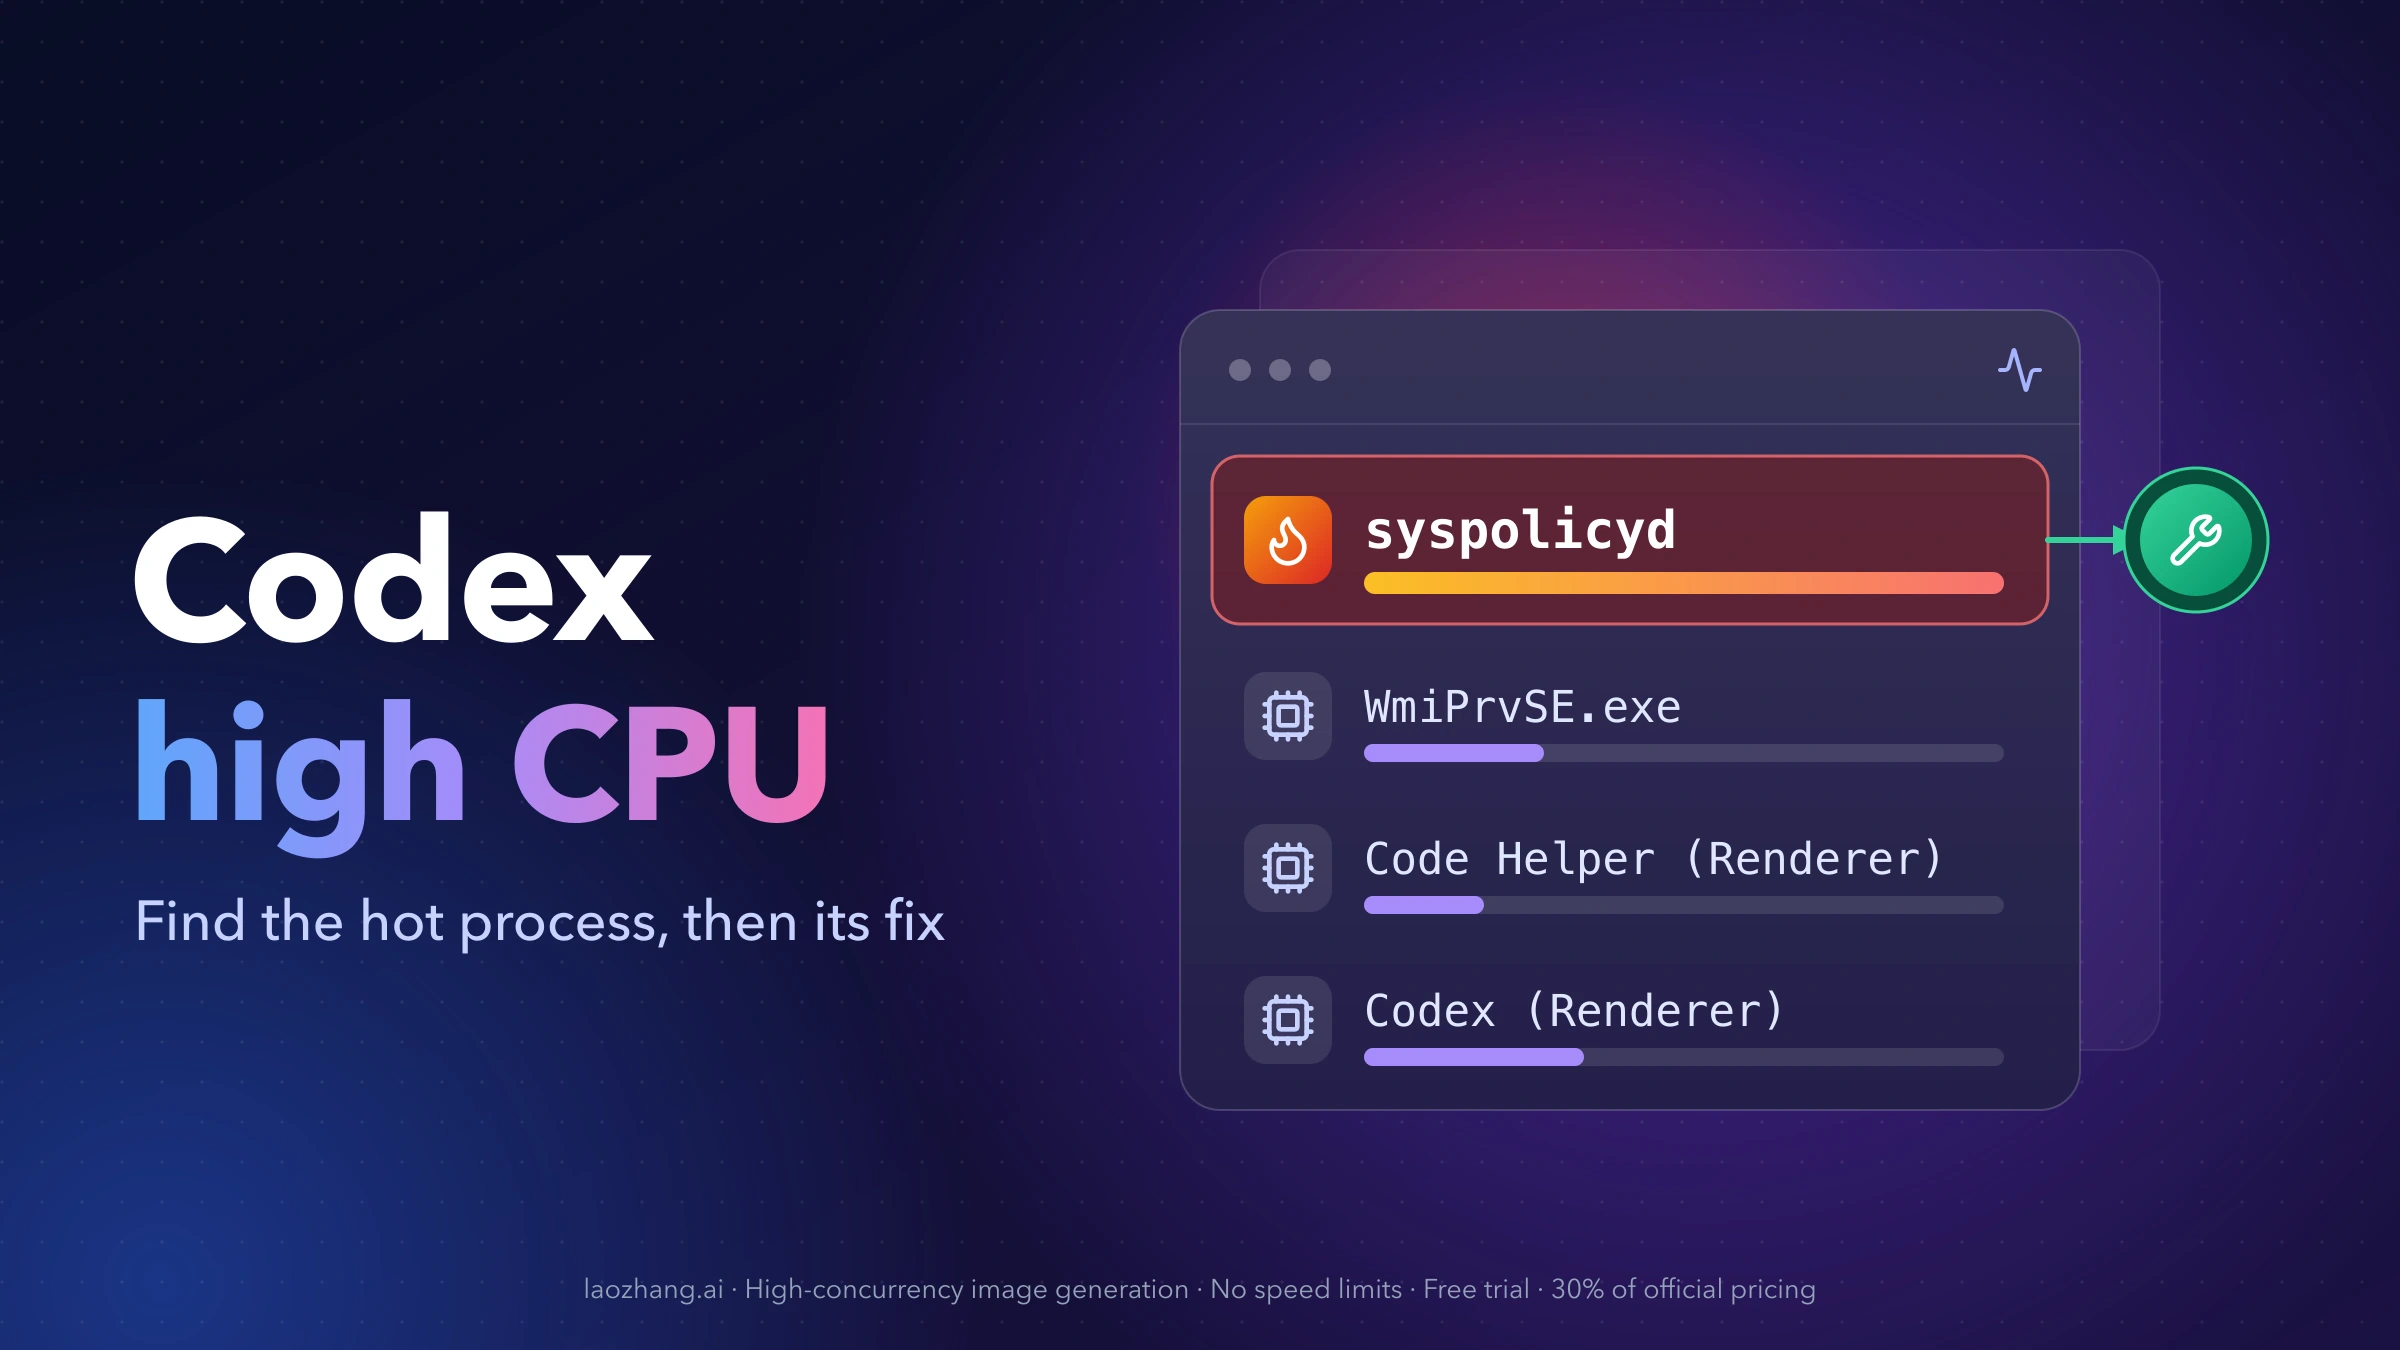
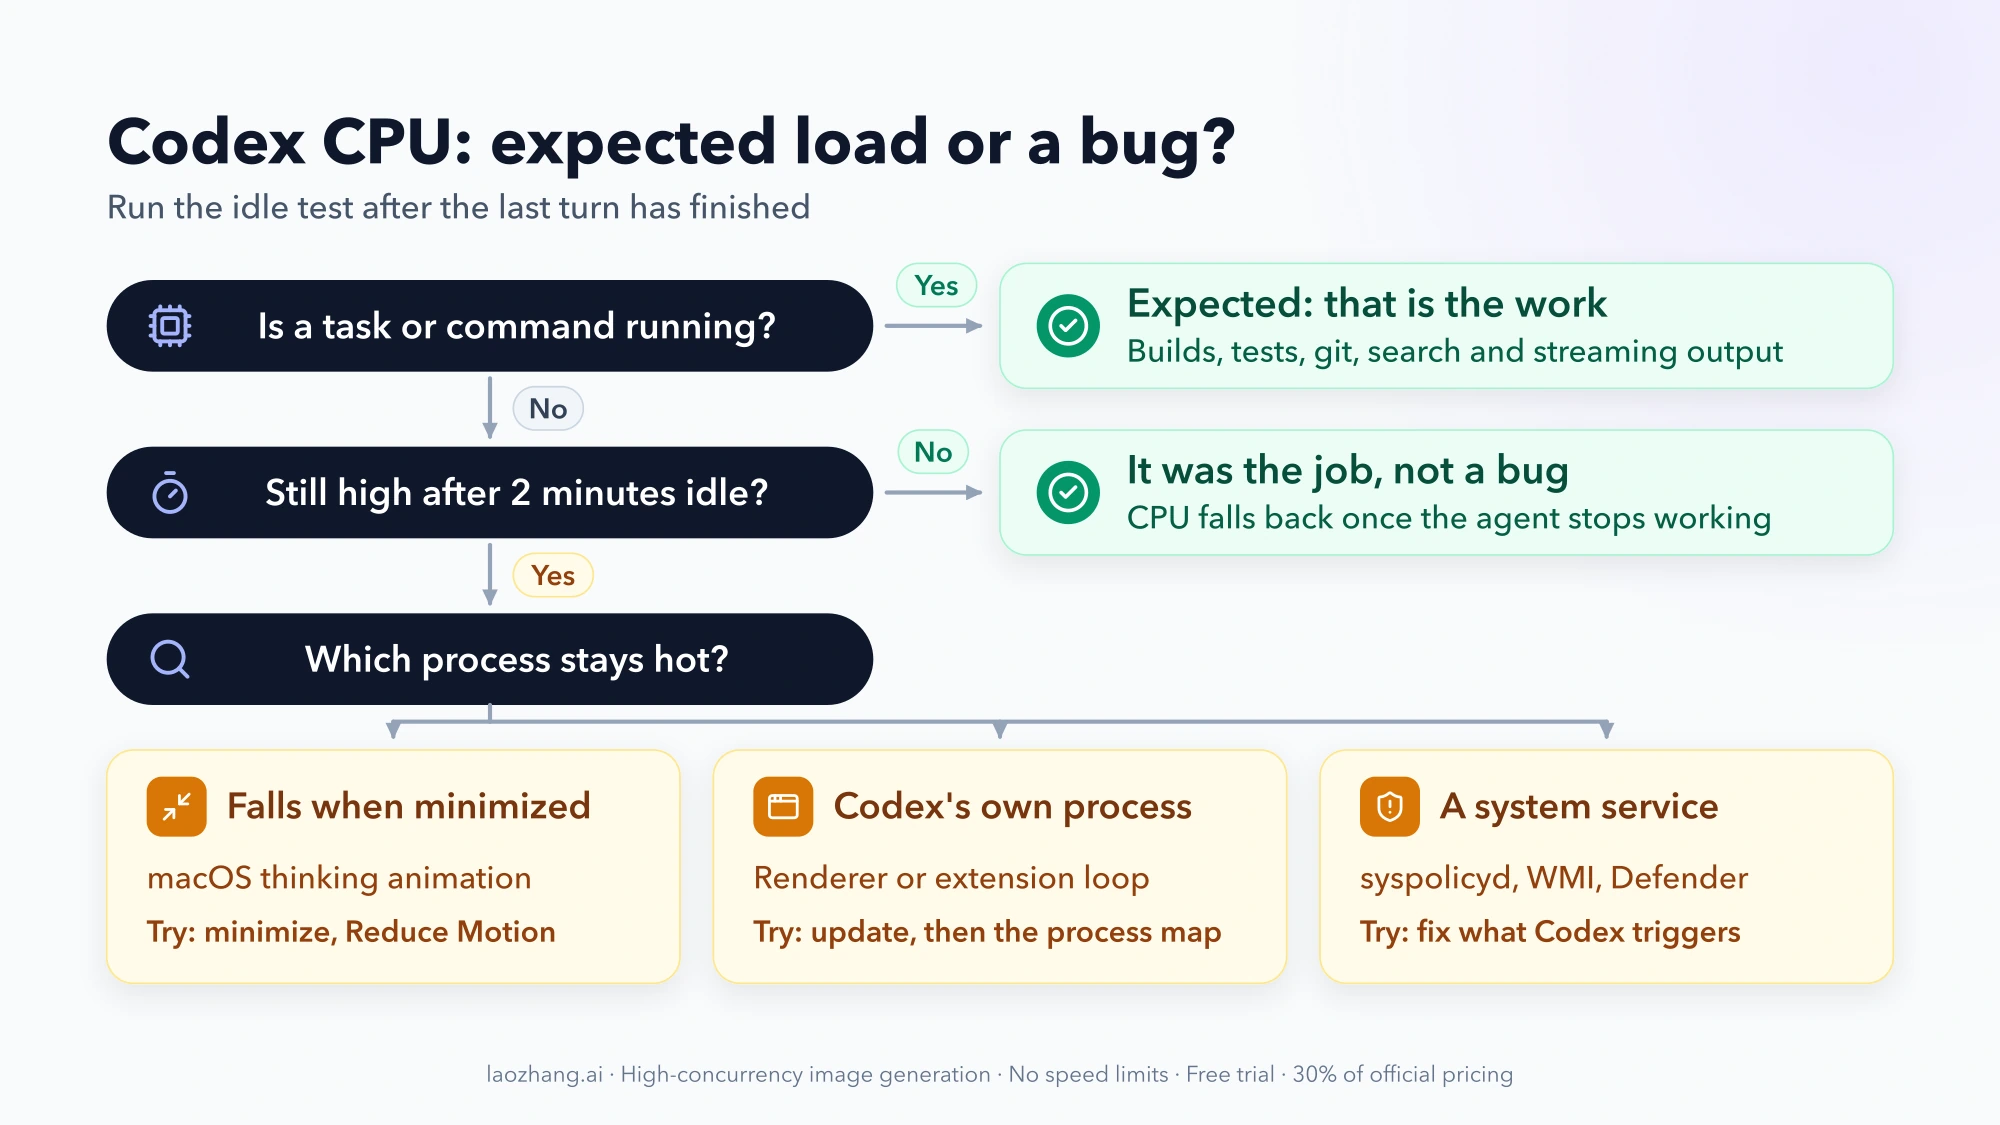
High CPU from Codex is normal while an agent is working: builds, tests, searches and git commands run on your machine, and the window keeps streaming output. It points to a bug in three situations:
- CPU stays high with no task running, minutes after the last turn finished.
- CPU jumped right after an app or extension update while your workflow stayed the same.
- The busy process is a system service Codex keeps waking, not Codex itself:
syspolicydortrustdon a Mac, WMI Provider Host, Antimalware Service Executable (Defender) or Desktop Window Manager on Windows.
Reinstalling rarely helps. Let the task finish, check which process is still hot, then use the fix for that process in the map below. Each fix is labeled by who backs it: an OpenAI engineer naming a fixed build in the GitHub issue, users who reported that it worked, or nobody yet.
One naming detail saves time. Since July 9, 2026 (app version 26.707), the Codex app has been part of the ChatGPT desktop app on macOS and Windows, with a Linux preview since August 11. Activity Monitor and Task Manager may show ChatGPT, ChatGPT.exe, Codex (Renderer) or Codex Helper (Renderer) depending on the build. In VS Code, the extension's load appears under VS Code's own processes, mainly Code Helper (Renderer) and Code Helper (Plugin).
Is high CPU normal while a Codex task is running?
Yes, within reason. A coding agent runs the same work you would run by hand: compiling, test suites, ripgrep across the repository, git status and diffs, plus a UI that redraws as tokens stream in. One Windows user on an i5 laptop described 60–100% CPU while the main agent ran a task and around 20% otherwise in GitHub Discussion #36406. OpenAI publishes no CPU baseline, so treat that as one person's data point, not a target.
A two-minute idle test tells the two cases apart:
- Wait until the last turn shows as finished and no command is running.
- Leave the app or editor open for two minutes without typing.
- Minimize the window for another minute and watch whether CPU falls.
If CPU drops back once work stops, you were seeing the job, not a bug. Running several agents or subagents in parallel multiplies the load by design. The Codex subagents guide covers when splitting work is worth that cost.
If CPU stays high when nothing is running, falls only when the window is minimized, or sits in a process that is not Codex, keep going.
Find the hot process on macOS, Windows, Linux and VS Code
The process name decides the fix, so find it before changing anything.
macOS. Open Activity Monitor, choose the CPU tab, sort by % CPU, and make sure View → All Processes is selected so system daemons such as syspolicyd, trustd, WindowServer and replayd are listed. From Terminal, this shows the top consumers:
ps -Ao pid,pcpu,etime,comm -r | head -15Windows. In Task Manager, the Processes tab groups everything under ChatGPT; the Details tab sorted by CPU shows the individual executables that matter here: WmiPrvSE.exe (WMI Provider Host), MsMpEng.exe (Antimalware Service Executable), dwm.exe (Desktop Window Manager), git.exe, taskkill.exe, conhost.exe, powershell.exe and node.exe. A process storm is easier to see as counts than as percentages:
Get-Process git, taskkill, conhost, powershell, node -ErrorAction SilentlyContinue |
  Group-Object Name | Select-Object Name, Count
Run it twice, 10 seconds apart. Counts that climb into the dozens or hundreds while Codex is idle point to the Windows storms described below.
Linux and the CLI. Sort by CPU and keep the full command line, so you can tell a codex session apart from the tools it launched:
ps -eo pid,pcpu,etime,args --sort=-pcpu | head -15VS Code extension. On macOS the load shows as Code Helper (Renderer) (the extension's chat panel) or Code Helper (Plugin) (the extension host); on Linux it often appears as code --type=zygote. Open the Output panel and select the Codex channel: the same error repeating many times per second, such as worker_rpc_response_error ... method=stable-metadata workerId=git, is a strong sign of a loop.
Also note your versions now, because every fix below depends on them. Run codex --version for the CLI. On macOS, the copy of Codex bundled with the desktop app reports its own version through /Applications/Codex.app/Contents/Resources/codex --version, and it can differ from your CLI, according to OpenAI's troubleshooting page. On Windows, the Store package number (for example 26.1007.9446.0) and the version shown inside the app (26.1007.71326) are different strings for the same build.
Codex CPU map: hot process, likely cause and fix status
Status labels, as of October 15, 2026:
- Fixed by OpenAI: an OpenAI engineer named a fixed build in the GitHub issue. Update to that build or later.
- Partly fixed: OpenAI shipped or attempted a fix that covers only some causes.
- Open: no OpenAI fix yet. The steps are workarounds that users reported.
OpenAI's public changelog lists most desktop releases as "performance improvements and bug fixes" and names no specific CPU fix, so the build numbers here come from engineers' replies in GitHub issues.
| Hot process | Likely cause | Try first | Status |
|---|---|---|---|
GPU process, renderer and WindowServer, only while Codex is "thinking" (macOS) | Animated "thinking" shimmer keeps the compositor busy, worse on large or high-refresh displays | Minimize or hide the sidebar while it works; Reduce Motion if your build has it; turn off Translucent sidebar | February wave fixed by OpenAI; current report open |
| Renderer at 100–150%, white screen, typing lag (any desktop OS) | Very large conversation histories or damaged local state | Archive the giant threads; back up and reset ~/.codex | Open |
syspolicyd / trustd (macOS), other apps fail to open | The app keeps launching child processes that macOS has to vet | Remove a broken .git folder in the workspace; quit, then sudo killall syspolicyd | Partly fixed (attempted in 26.602.30954) |
replayd, SkyComputerUseService, zombie processes (macOS) | Computer Use helper loops | Update macOS to 14.4 or later; turn Computer Use off; quit the app | Open |
Main ChatGPT / ChatGPT.exe process at idle | Busy loops in the app's main process | Update; restart; on macOS, back up and reset ~/.codex | One Windows loop fixed in 26.810.7004.0; others open |
WMI Provider Host + powershell.exe (Windows) | Process polling through PowerShell about once a second | Update to 26.730.7989.0 or later | Fixed by OpenAI (major sources) |
git.exe, taskkill.exe, conhost.exe, Defender, dwm.exe (Windows) | Git scans over untracked files, a home folder that is a Git repo, cleanup storms | .gitignore or commit untracked files; rename %USERPROFILE%\.git; update to 26.825.32147 or later | dwm.exe cause fixed by OpenAI; taskkill floods open |
Code Helper (Renderer) / (Plugin) (VS Code) | Retry loops in the extension; workspace folder that is not a Git repo | Update the extension; git init in non-Git folders; Reload Window | One loop fixed in v26.415.20818; others open |
Dozens of node / MCP processes (all) | A full MCP server set started per thread and not cleaned up | Disable unused MCP servers; close finished threads; restart | Open |
codex app-server in WSL, slow commands | CODEX_HOME on /mnt/c, rescanned on every command | Keep CODEX_HOME and repositories on the WSL filesystem | Open; matches OpenAI's WSL guidance |
Idle codex CLI sessions (Linux) | Skills watcher watching /etc and $HOME | Create the three skills folders | Open |
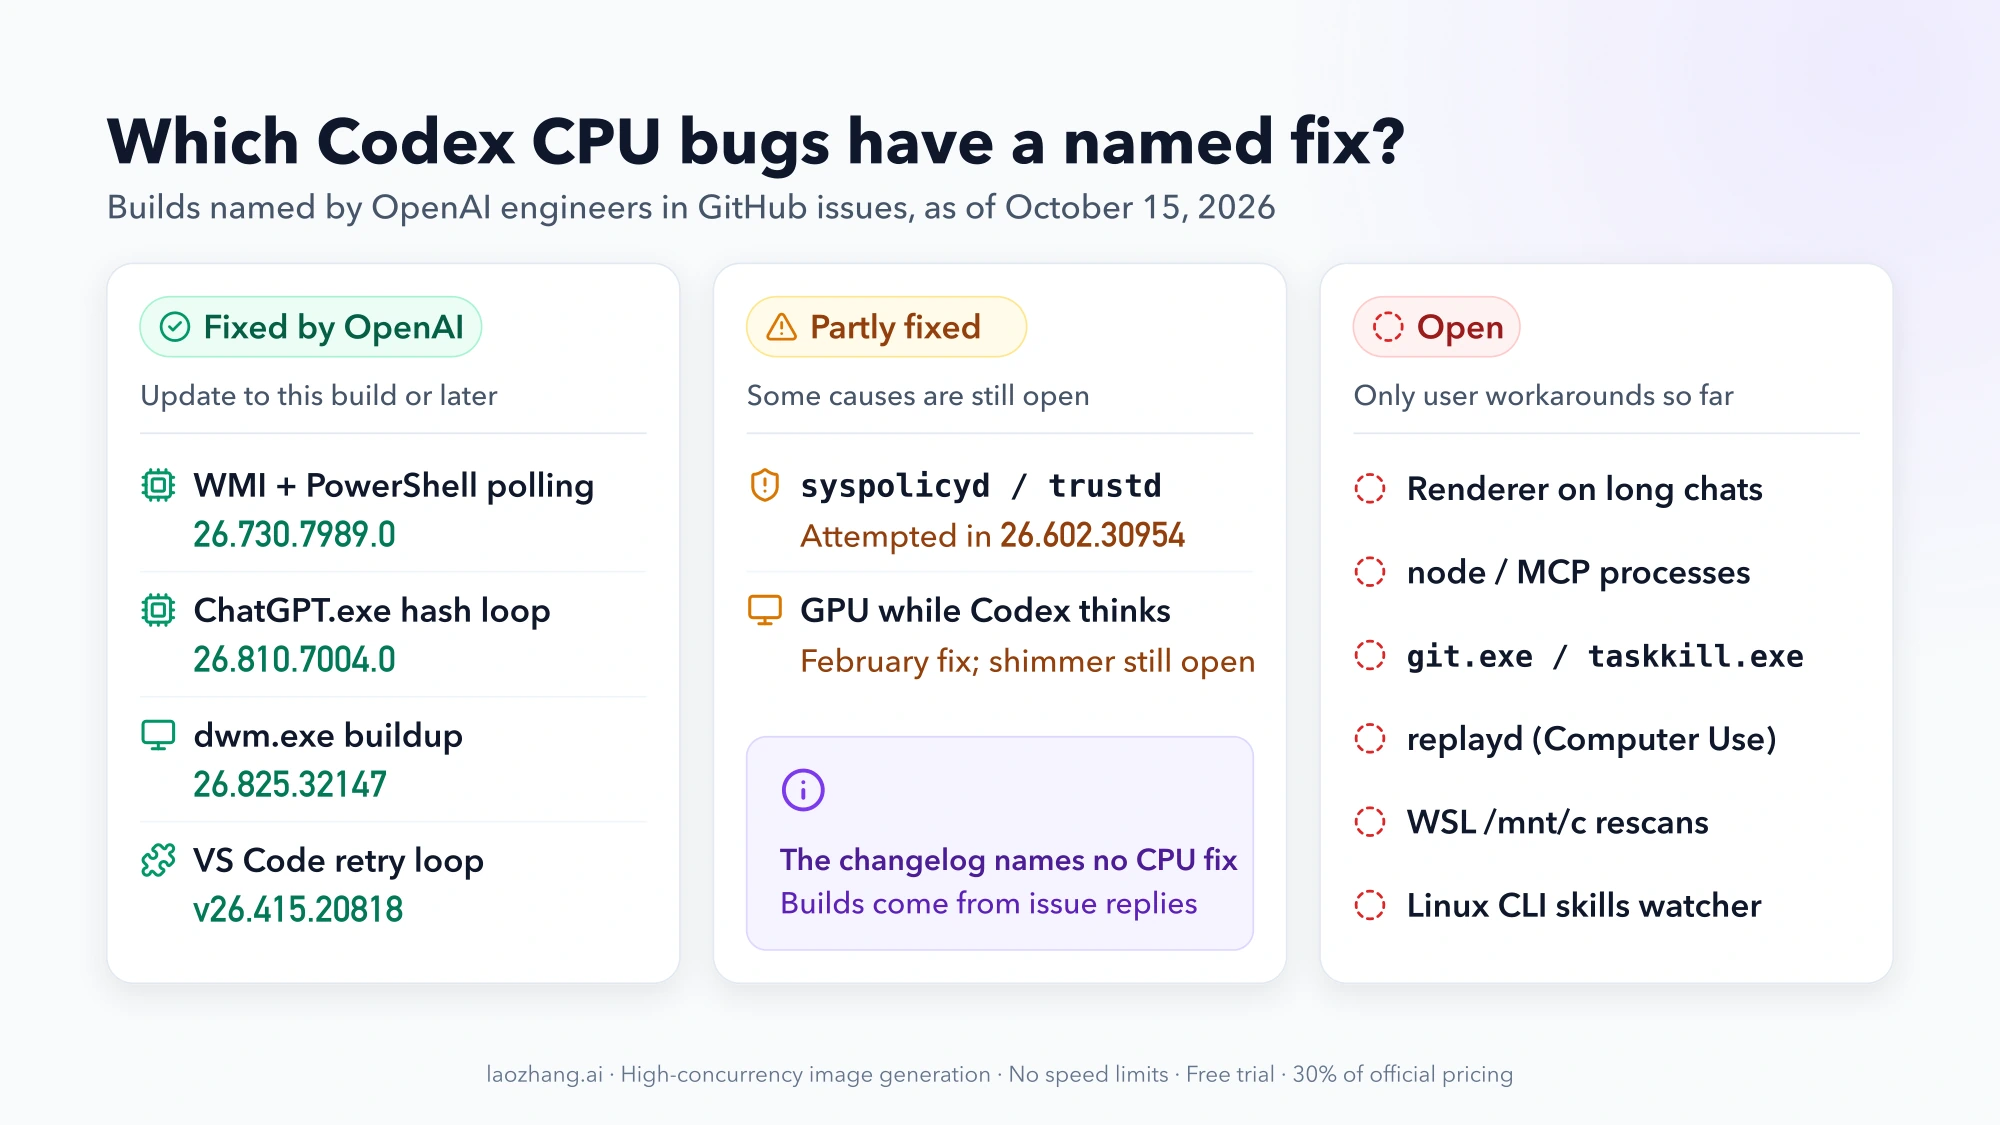
The sections below give the steps for each row and what the reports say about them.
macOS: GPU process, renderer or WindowServer busy while Codex thinks
If fans spin up only while Codex shows its "thinking" animation and calm down when you minimize the window, you are seeing the animation cost, not the agent.
In February 2026, macOS users reported 70–90% GPU from the app. An OpenAI engineer said in issue #10432 that the GPU problem was "fixed — or at least significantly improved" in the next release. The pattern came back in a narrower form: issue #16857, still open with no OpenAI reply (latest comment October 13, 2026), traces it to a small looping shimmer and "working" dots that keep the renderer, GPU process and WindowServer busy. Large external monitors and high refresh rates make it worse.
What users report helps, in order of effort:
- Minimize the window or hide the sidebar while a long task runs. Several users saw GPU load fall close to zero when minimized; one reported 70% down to 3% with the sidebar hidden, another saw no change.
- Turn on Reduce Motion in the app's settings, if your build has it. One user's GPU service CPU dropped from 18–29% to about 10%. A September profile showed the loading shimmer still running with it on, so expect partial relief.
- Turn off Translucent sidebar under Settings → Appearance. One user said GPU returned to normal.
A separate May report, issue #25077 from an Intel MacBook Pro with two external displays, showed WindowServer, the GPU helper, the renderer and codex app-server all busy together. The reporter's workarounds were using the CLI for long sessions and disconnecting the external displays.
Renderer at 100% on long chats, white screens and typing lag
A renderer process (Codex (Renderer) or Codex Helper (Renderer)) holding one full core or more, often with white screens or a second of lag per keystroke, has a different cause: the app loading very large conversation histories. Reports span macOS, Windows and Linux. In #18693, copying profiles with and without a few giant threads isolated the large histories as the trigger, and a mid-October report on macOS 26.1007.41230 (#53882) traced a renderer stuck at 100% to history-loading code. No OpenAI engineer has replied in these issues.
What helped users, from least to most disruptive:
- Archive the largest threads and continue in a new one. The original reporter and other users confirmed this helps. A thread that has run for days with large tool outputs is the usual suspect.
- Force-quit only the renderer process in Activity Monitor or Task Manager. The window reloads and CPU drops, but it comes back once the heavy thread loads again.
- Back up and reset
~/.codex(steps in the backup section below). This cleared the problem for two reporters and failed for a third, #51401, whose renderer stayed at about 150% even after a full profile reset and reinstall.
Several October reports also show the app retrying "thread access denied" reads for shared or cloud chats every few seconds alongside high renderer CPU (#53178). The reporters themselves say the link to CPU is not proven, and restarting does not stop the retries.
macOS: syspolicyd or trustd at high CPU and apps won't open
When syspolicyd or trustd sits near the top of Activity Monitor, often with other apps refusing to launch, downloads flagged as "damaged" or "Too many open files" errors, the app is repeatedly starting child processes that macOS's security service has to check. Users traced the loop in #16767 and #25719; OpenAI made #25243 the main report for it.
Status: partly fixed. On June 5, 2026, an OpenAI engineer wrote that a fix was attempted in 26.602.30954 but may not have fixed it completely, and asked anyone still affected to send a feedback session ID. Some users said that build stopped their storm; others kept seeing it in July builds. The issue is still open, with no newer OpenAI update.
User-reported steps, safest first:
- Look for a broken or stray
.gitfolder in the folders you opened as workspaces, including an empty or half-written.git. Removing it is the step with the most confirmations (five or more in #25243). Check a folder withgit -C ~/path/to/project status; an error about a corrupt or invalid repository marks a candidate. Move it aside rather than deleting it if you are not sure. - Quit the app, then run
sudo killall syspolicyd. macOS starts the service again on its own. Several users confirm this brings CPU down, but the storm returns while the trigger is still there.
One user also removed old, unused projects from the configuration; it helped only briefly.
Avoid the shortcuts some users tried: disabling System Integrity Protection with csrutil disable or exempting the app from Gatekeeper's checks trades a CPU problem for a security one. Downgrading to an older build worked for a few people, but those builds miss later fixes. One user also reported that deleting the whole ~/.codex folder did not stop the storm.
Computer Use on macOS: replayd loops and zombie helper processes
If you have used Computer Use, two more macOS patterns are open as of mid-October, both with no OpenAI reply:
replaydnear 90% CPU while idle, withSkyComputerUseServicealso busy. Issue #37420, updated October 14, 2026, reports it on macOS 14 (Sonoma). The reporter gotreplaydto 0% by turning off Computer Use and removing its components; another user found the app restarted the service anyway.- Helper and zombie processes piling up until typing lags or new processes fail to start (#25744). On macOS versions older than 14.4, the Computer Use service crashed and restarted in a loop; two users stopped it by updating macOS to 14.4 or later.
Quitting the app clears the pile temporarily. One user believes build 26.901.51231 fixed a helper-respawn swarm; OpenAI has not confirmed that. If you do not need Computer Use, turning it off is the low-risk test.
ChatGPT main process busy at idle on Windows or macOS
A main ChatGPT.exe or ChatGPT process (not a renderer) burning a full core while nothing is happening has three known causes:
- Windows builds around 26.810.4967 re-hashed a large file in a loop and made the whole PC stutter. Status: fixed by OpenAI. An OpenAI engineer said in #38547 that 26.810.7004.0 addresses it. Update.
- Windows, after archiving a thread that owned a managed worktree: the app keeps watching the deleted folder and uses about one core (#44960, open, seen again on 26.1007.2314.0). Restarting the app clears it.
- macOS 26.1007.21159: a worktree archive queue retries dozens of times per second and holds the main process near 87% even after restarts (#52798, open). The reporter's only working fix was a reset of
~/.codexthat restored configuration but left local history behind.
Windows: WMI Provider Host and powershell.exe at high CPU
WMI Provider Host (WmiPrvSE.exe) climbing as high as 90–100% while the app is open, together with powershell.exe windows flashing or appearing in Task Manager about once a second, came from the app polling its child processes through PowerShell (#25453, #29499).
Status: fixed by OpenAI for the major sources. On August 5, 2026, an OpenAI engineer said fixes shipped in 26.730.7989.0. Update to that build or later and restart. A few users still saw WMI load on 26.803 and 26.810 builds. If yours persists after updating, check the taskkill.exe and git.exe counts from the PowerShell command above, because that storm also drives WMI and is tracked separately.
Windows: git.exe, taskkill.exe, Defender or dwm.exe storms
This is the most common Windows pattern in the reports. Hundreds of git.exe, taskkill.exe and conhost.exe processes start and exit while Codex looks idle. Each one wakes WMI and Defender, so Antimalware Service Executable and WMI Provider Host climb with them, and long sessions can leave Desktop Window Manager (dwm.exe) sluggish across the whole desktop.
Status: one cause fixed, others open. An OpenAI engineer said ChatGPT v26.825.32147 fixes the dwm.exe buildup from sandboxed commands (#20214). The same engineer said taskkill.exe floods still had to be resolved separately; #34260 remains open.
Two user fixes have repeated confirmations:
1. Cut the number of untracked files Codex has to scan. Codex runs Git queries over every untracked file to show changes. A project with thousands of untracked build outputs triggers thousands of Git processes (#34014). Count them from the project folder:
git ls-files --others --exclude-standard | Measure-Object -LineIf the number runs into the thousands, add the generated folders to .gitignore (or commit what belongs in the repo). About five users reported WMI load falling sharply after doing this, one from 40% to under 1%.
2. Check whether your home folder is a Git repository. An accidental .git in %USERPROFILE% makes every folder under it, including the projectless chats the app keeps under Documents, part of one huge repository. Users in #16786 and #33875 traced idle Git scans and growing kernel memory to it; at least three cut the load sharply by renaming it, including one on 26.1002.7124.0 in October.
Test-Path "$env:USERPROFILE\.git"
# If True and you did not create it on purpose:
Rename-Item "$env:USERPROFILE\.git" ".git-backup"
Skip the rename if you deliberately keep your home folder under Git, for dotfiles for example. Renaming keeps the history recoverable.
Two things not to do. Do not turn off Defender or its real-time protection. Users in #33875 found that Defender exclusions did not help, and disabling real-time protection only moved the CPU load to Codex itself. Killing git.exe or taskkill.exe by hand does not help either: the count climbs right back.
The same scans can grow Windows kernel memory (the NtFC nonpaged pool) until the machine freezes. Removing the home-folder .git slowed that growth for three users, and a reboot clears what has built up. A related open report, #41982, describes opening an existing chat from the ChatGPT Android app's remote mode starting one Git process per untracked file on the Windows host, still seen on October 15, 2026; fewer untracked files limit the damage there too.
VS Code: Code Helper (Renderer) high CPU from the Codex extension
When Code Helper (Renderer) or Code Helper (Plugin) runs at 100% or more with the Codex panel open, the extension is usually stuck retrying something.
Status: one loop fixed, others open. An OpenAI engineer confirmed a fix for an error-retry loop in the extension's panel, and users reported it fixed in v26.415.20818 in April 2026 (#16849). Reports of high CPU continued under #7972 and #15393, both still open, with the latest comments from May and July.
Steps users confirmed:
- Update the extension (ID
openai.chatgpt) from the Extensions view, then reload. - If the workspace folder is not a Git repository, run
git initin it or use the Source Control view's Initialize Repository button. With a non-Git folder, the extension kept retrying a Git lookup, and the Output panel repeatedworker_rpc_response_error ... method=stable-metadata workerId=git. Several users in #17394 saw CPU fall immediately after initializing a repo. The issue was closed as completed in August 2026; until then users kept reporting it on June builds. - Run "Developer: Reload Window" or "Developer: Restart Extension Host" from the Command Palette. This stops a running loop until the trigger comes back.
- Start a new thread if CPU rises only when one old thread is open. Users saw CPU drop in a fresh thread and rise again when they reopened the old one.
Community patches that edit the extension's bundled JavaScript worked for some users, but every extension update overwrites them. Pinning an old extension version has the same drawback and misses later fixes.
Dozens of node and MCP processes: memory pressure becomes CPU
If Task Manager or Activity Monitor shows dozens or hundreds of node, node_repl or MCP server processes, the problem starts as memory, not CPU. Each chat, resumed thread, subagent and some hidden background tasks start their own full set of the stdio MCP servers you configured, and those sets stay alive while the chat stays loaded. Reports in #30408 and #53285 show 300 to 900 helper processes using 9–19 GB. Once the machine starts paging, CPU climbs with it.
Status: open. An OpenAI engineer pointed to a pending pull request for subagent cleanup in April, and users reproduced the leak on 26.1007.30912 in October.
What reduces it, per users:
- Disable MCP servers you rarely use, and move project-specific servers out of
~/.codex/config.tomlinto that project's.codex/config.toml, so they start only there:
[mcp_servers.playwright]
enabled = false- Prefer servers you reach by URL (
url = "https://...") over ones Codex starts as local commands, when the server offers both. Two users reported that URL-based servers added no child processes at all. - Archive or close finished chats instead of leaving many open, and restart the app after long sessions with subagents.
The Codex config.toml guide explains where each config layer lives and how to check an MCP entry after editing it.
WSL and the Linux CLI: /mnt/c rescans and the skills watcher
WSL. If commands are slow and codex app-server inside WSL is busy with file access, check where CODEX_HOME lives. Issue #26149, still open on 26.1007.9446.0, shows the app rescanning the plugin cache under /mnt/c/Users/<you>/.codex before commands; one user measured 2 minutes 21 seconds per command, down to about 5 seconds after moving the cache folder (.codex/.tmp) onto the WSL filesystem, and another fixed it by moving the whole CODEX_HOME there. That matches OpenAI's own WSL guidance: work under your Linux home (for example ~/code), not /mnt/c. For large repositories, the same page suggests giving WSL more memory and CPU and running wsl --update.
Linux CLI at idle. Each idle codex session using a few percent of a core, multiplied by every agent on the host, is a skills-folder watcher problem (#49881, open). When the skills folders do not exist, the watcher falls back to watching /etc and your home directory and wakes on every process start. Creating the folders fixed it for two users, including on CLI 0.162.1:
sudo mkdir -p /etc/codex/skills
mkdir -p ~/.agents/skills ~/.codex/skills
Idle CPU per session dropped to 0.0–0.1% for both.
Back up ~/.codex before you reset it
Several fixes above end with "reset ~/.codex". That folder holds your configuration, local session history (~/.codex/sessions), archived sessions and the app's local databases. Moving it aside means the app starts clean, and your local history stays out of sight until you put it back. Users report this cleared renderer and archive-queue loops in some cases and did nothing for syspolicyd. Treat it as the last local step, not the first.
On macOS or Linux, quit the app completely first, then:
mv ~/.codex ~/.codex-backup-$(date +%Y%m%d)On Windows, quit the app (including from the system tray), then in PowerShell:
Rename-Item "$env:USERPROFILE\.codex" ".codex-backup"Start the app, sign in, and check CPU. If the problem is gone, copy back only your configuration from the backup: config.toml, plus folders such as skills, rules and memories if you use them. Leave the session folders and database files in the backup: the reporter whose reset worked restored only configuration. If the reset did not help, quit, remove the new folder and rename the backup to .codex again to get everything back.
Never hand-edit or move individual session files or database rows to trim history. One user who did found the thread list broken afterward. Archive threads from the app instead.
What to send OpenAI when Codex CPU stays high
Stop trying local fixes when the hot process is one of the open patterns above, you have updated, and the two-minute idle test still fails. A specific report gets further than a +1:
- A feedback session ID. Type
/in the composer, choose feedback, and share the current session if the problem happens in that chat. You get a session ID to quote, per OpenAI's troubleshooting page. OpenAI engineers asked for exactly this in thesyspolicydand VS Code threads. - Versions: the app version (and the Windows Store package number if you are on Windows), the extension version in VS Code,
codex --versionfor the CLI, and your OS version. - The hot process and its numbers: name, % CPU, and whether it happens idle or only during a task, with the window visible or minimized.
- Logs if asked: on macOS, app logs live in
~/Library/Logs/com.openai.codex/YYYY/MM/DD; session transcripts in~/.codex/sessions. OpenAI's documentation lists no Windows log path. Read logs before sharing, since they can contain code, paths and tokens.
Then search the Codex GitHub issues for your process name and add these details to the matching report, or open a new one if none matches. Users in several threads also report that the CLI stays normal while the desktop app spikes, which can keep you working in the meantime.
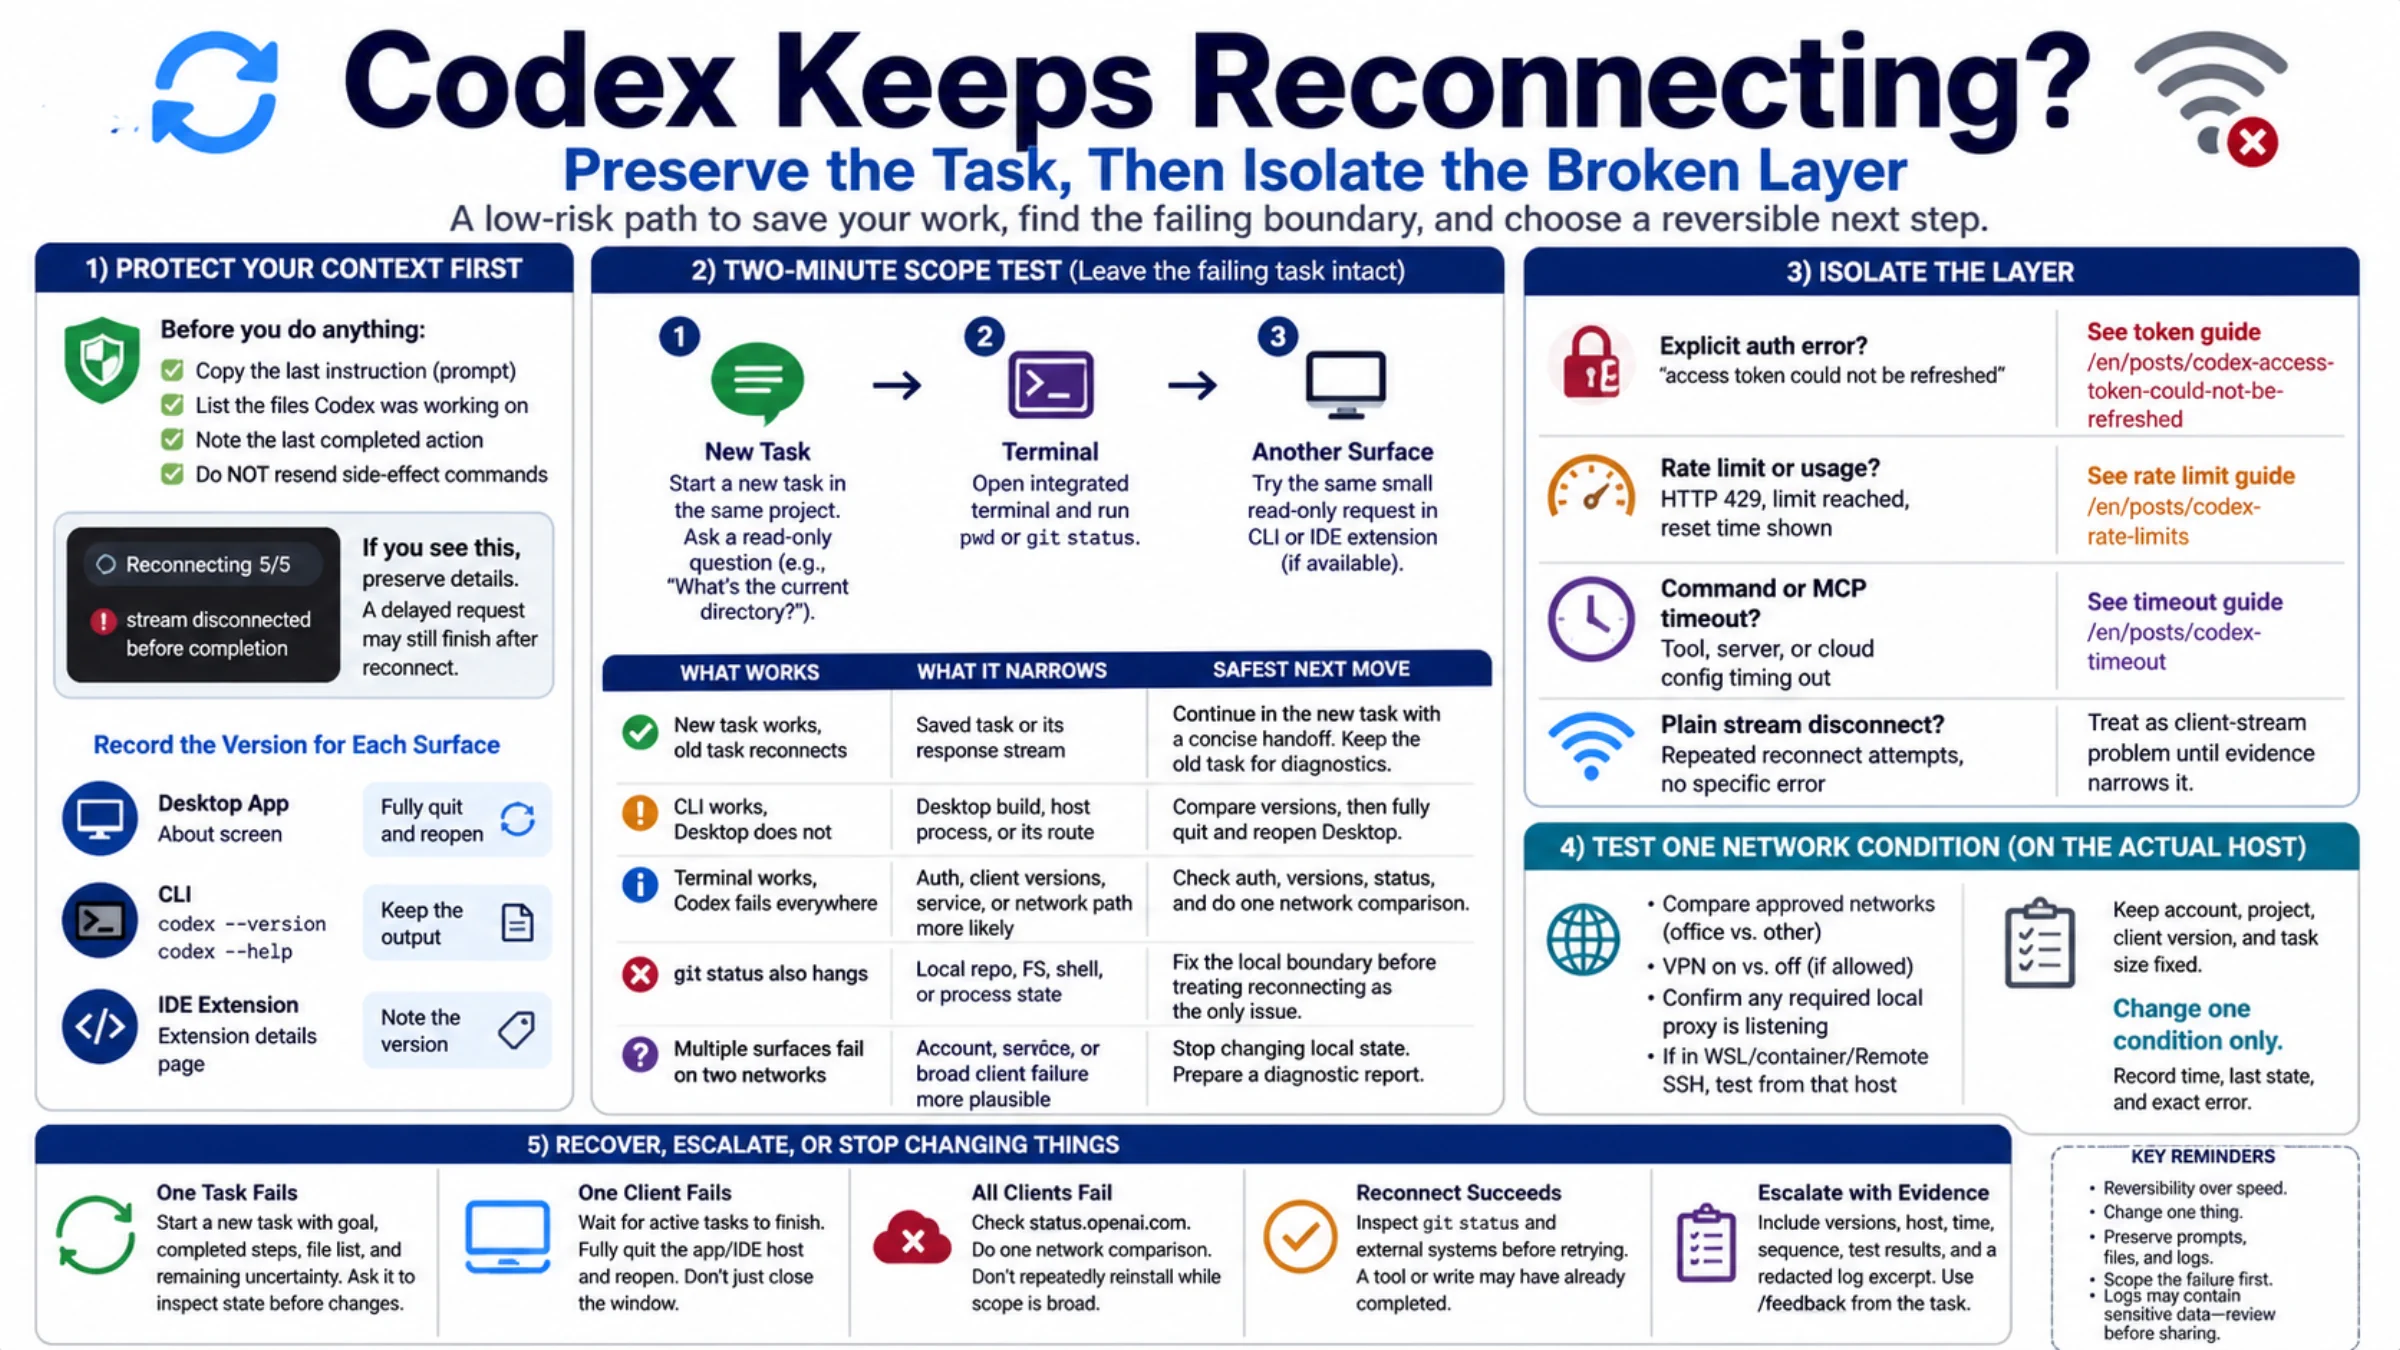
If Codex is stuck on "Reconnecting" or "Thinking" rather than hot, see Codex keeps reconnecting; if the app will not start at all on Windows, see failed to start Codex app-server.
Codex CPU questions: slowdowns, the CLI and updates
Why is Codex using so much CPU?
During a task, it is doing work on your machine: running builds, tests, searches and Git, and drawing the streamed output. When CPU stays high with no task running, the process name points to the cause: a renderer loading huge chat histories, macOS security checks, Windows Git and WMI storms, an extension retry loop, or leftover MCP processes. The map above pairs each one with its fix.
Does Codex slow down your PC?
While it works, it competes with you for CPU like any build or test run. The serious slowdowns in the reports come from bugs: Windows storms that drag WMI, Defender and Desktop Window Manager with them, macOS syspolicyd loops that stop other apps from launching, and helper processes that eat memory until the system pages. Those are fixable or avoidable once you know which one you have.
Does Codex use my computer?
For local work, yes. When Codex works in a project on your machine, the commands it runs (compilers, test runners, git, file searches) use your CPU, memory and disk. With Computer Use enabled on macOS, it also runs helper services that operate apps on your screen.
Will switching to the Codex CLI stop the high CPU?
It often helps, but it is not a guarantee. Users in several desktop threads report the CLI running normally while the app spiked, because the app's window, animations and background Git views are not involved. The CLI has its own open reports, though: the Linux skills watcher and the MCP process buildup both affect it.
Is Codex high CPU fixed in the latest version?
Some causes are, with named builds: Windows WMI polling (26.730.7989.0), the Windows main-process hash loop (26.810.7004.0), the dwm.exe buildup (26.825.32147) and one VS Code extension loop (v26.415.20818). As of October 15, 2026, the newest builds in user reports are 26.1007.71326 on macOS, 26.1007.9446.0 on Windows and CLI 0.162.1, and open reports for renderer loops, MCP process buildup, Windows Git storms and WSL rescans continue on 26.1007 builds. Update first, then use the process map to see whether your case is one of the open ones.